Why Physical Demand is Shaking Up Silver Trading
Disclaimer: This article provides educational information on silver market dynamics based on publicly available data as of February 2026. It is not financial advice, investment recommendations, or guarantees of future performance. Market conditions can change rapidly; consult qualified professionals for personalized guidance.
By Doug Young – 20 February 2026
Introduction
Current Market Snapshot
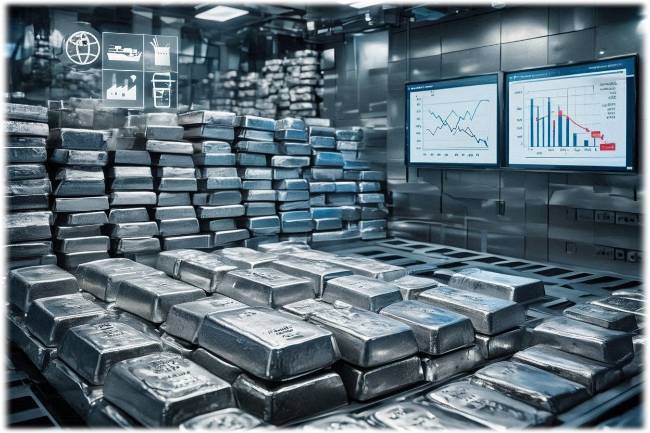
Silver prices have fluctuated amid tightening physical supplies on COMEX warehouses, where registered inventories recently dipped below 100 million ounces.
This comes as global demand from industrial sectors outpaces mine production for the sixth straight year, creating ongoing market deficits estimated at around 67 million ounces for 2026.
Traders and analysts watch closely as these dynamics challenge the exchange’s traditional role in price discovery.
Role of COMEX in Silver Pricing
COMEX, operated by CME Group, serves as the primary Western benchmark for silver futures, facilitating hedging for miners and manufacturers while providing liquidity through speculators.
Contracts represent 5,000 ounces each, with trading volumes often exceeding 100,000 contracts daily and open interest hovering near 130,000-150,000 contracts in early 2026.
The system relies on participants rolling positions rather than taking physical delivery, but rising stand-for-delivery notices test this balance.
Silver’s Evolving Demand Drivers
Industrial Applications in Tech and Energy
Silver’s unmatched conductivity drives its use in photovoltaic solar cells, where each panel requires about 20 grams, fueling record installations projected to consume over 200 million ounces in 2026.
Demand from semiconductors, electric vehicle batteries, and AI data centers adds further pressure, as these sectors prioritize performance over cheaper alternatives.
Efforts like China’s shift to copper in some solar tech highlight substitution challenges amid rising costs.
Medical and Defense Uses
In medicine, silver enables advanced imaging and antimicrobial applications, while defense systems incorporate it in radar, communications, and electronics for reliability in high-stakes environments.
The U.S. government lists silver as a critical mineral, underscoring its embedded role in national security infrastructure.
Supply Constraints
Byproduct Mining Limitations
Roughly 75% of silver originates as a byproduct of copper, lead, and zinc mining, limiting output responsiveness to price signals—global mine supply stabilized around 800-830 million ounces annually despite demand growth.
New primary projects face long lead times and environmental hurdles.
Recycling and Above-Ground Stocks
Recycling supplies about 180 million ounces yearly, but deficits draw down finite above-ground stocks, including COMEX vaults and private holdings.
These buffers prevent immediate shortages but cannot sustain multi-year imbalances indefinitely.
China’s Refining Dominance and Export Policies
China controls over 40% of global silver refining capacity, processing imports into fabricated goods for export.
Recent policy shifts, including reduced exports starting early 2026, have widened Shanghai premiums to $10+ over COMEX, redirecting flows to domestic manufacturing.
COMEX Mechanics Under Pressure
Eligible vs. Registered Inventories Explained
COMEX tracks “eligible” silver in approved vaults (not committed to contracts) separately from “registered” metal available for immediate delivery.
Registered stocks form the core settlement buffer; declines here heighten reliance on rolls and inflows.
Open Interest Trends (133,641 contracts as of Feb 10, 2026)
Open interest, measuring outstanding contracts, fell week-over-week by about 9,500 in mid-February 2026, reflecting deleveraging amid volatility.
Levels remain elevated relative to deliverable supply, with total eligible inventories over 250 million ounces.
Delivery Process in Major Months like March
March marks a primary delivery month; notices require registered metal transfer, with recent February activity exceeding prior norms.
Exchanges can impose cash settlements in extremes, though rare, to maintain operations.
Recent Market Data
Inventory Declines (Below 100M oz registered)
Registered silver hit lows near 98 million ounces on February 11, 2026, after sharp withdrawals, straining the ratio to open interest.
Margin Requirement Adjustments
CME raised initial margins to $25,000 per contract in late 2025, with subsequent hikes during volatility to curb speculation and favor commercial hedgers.
Delivery Notices Surge in Early 2026
Deliveries outpaced 2024 levels in several 2025 months and continued elevated into February 2026, signaling some holders prioritize possession.
Persistent Structural Deficits
Silver Institute Forecast: 67M oz Shortfall in 2026
The Silver Institute projects a 67 million ounce deficit for 2026, following five prior years of shortfalls totaling over 300 million ounces, driven by industrial uptake exceeding total supply.
Historical Context (Sixth Consecutive Year)
Demand has surpassed mine output plus recycling since 2021, with investment demand adding to tightness amid economic uncertainty.
Global Comparisons
Shanghai vs. COMEX Settlement Models
Shanghai emphasizes physical delivery in pricing, with higher settlement rates tied to regional demand, contrasting COMEX’s financial focus.
Regional Premiums and East-West Flows
Western futures lag physical premiums in Asia, where export curbs funnel supply to local solar and electronics production.
Key Metrics to Monitor
Open Interest Relative to Stocks
Ratios above 1:1 (paper claims vs. registered metal) indicate leverage; contractions suggest adjustment.
Delivery Participation Rates
Rising stand rates in non-major months like February signal motive shifts.
Margin Policies and Position Limits
Hikes and caps reduce speculative dominance, promoting physical linkage.
Broader Implications
Geopolitical and Policy Factors
U.S.-China rivalry over supply chains elevates silver’s strategic status, potentially spurring domestic refining or stockpiling.
Impact on Price Discovery Credibility
Erosion in deliverability could prompt users to seek alternatives like Shanghai, altering global benchmarks.
Conclusion
Educational Takeaways on Market Dynamics
Understanding COMEX data reveals how physical realities influence futures markets, with deficits and deliveries as core indicators of balance.
Sources for Further Reading
Refer to CME Group reports, Silver Institute surveys, and official inventory updates for ongoing developments.
Disclaimer: This article provides educational information on silver market dynamics based on publicly available data as of February 2026. It is not financial advice, investment recommendations, or guarantees of future performance. Market conditions can change rapidly; consult qualified professionals for personalized guidance.

MEET THE RESEARCHER
Doug Young Financial Markets Researcher & Former Financial Director
- Over 20 years of experience in financial markets
- More than 15 years specializing in Gold IRAs
- Extensive expertise in precious metals trading
- Former Financial Director at World Freight Services Ltd for 16 years.
- Author of 500+ published financial research articles over 10 years
- Conducted 80+ Gold IRA company evaluations since 2011


