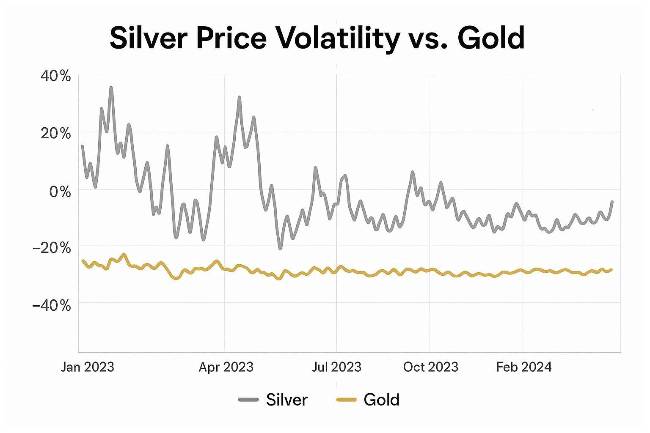
Current Silver vs. Gold Volatility Comparison
Disclaimer: This article provides educational information on market dynamics and is not financial advice. Past performance does not predict future results. Consult a qualified financial advisor before making investment decisions.
By Doug Young – 09 February 2026
Introduction
Silver prices experienced a sharp 17% decline to around $72 per ounce in early February 2026, contrasting with gold’s relative stability during the same period.
This movement highlights silver’s historically higher volatility compared to gold.
The following analysis examines structural market factors contributing to these dynamics.
Recent Price Snapshot
Silver reached a peak of $121.64 per ounce in January 2026 before the pullback.
Gold declined only about 2% in the same timeframe, underscoring differing responses to market pressures.
Silver vs. Gold Volatility Comparison
Historical Data Overview
Period Silver Peak-to-Trough Swing Gold Swing Key Event Jan 2025–Jan 2026 +293% ($30 to $118/oz) Moderate rise Rapid advance Jan 31, 2026 -27.5% single day Smaller drop Extreme day Feb 2026 -17% to $72/oz -2% Futures liquidation Silver recorded nine extreme volatility days in January 2026 alone, matching all of 2025.
Structural Supply Factors
Byproduct Dominance
Approximately 67% of silver originates as a byproduct from copper, zinc, and lead mining, which does not adjust quickly to silver price changes. This inelasticity creates persistent supply deficits during demand surges.
Investment Float Disparity
Silver’s investable float is roughly 1/65th of gold’s in dollar terms, making it prone to outsized reactions from investor flows.
Industrial Demand Dynamics
Key Sectors
Solar PV: Forecasted global capacity of 665 GW in 2026, consuming 120-125 million ounces.
Electric Vehicles (EVs): 14-15 million units projected, adding 70-75 million ounces.
Other Uses: Grid upgrades and data centers contribute 15-20 million ounces annually.
Demand remains price-inelastic in these areas, with manufacturers hedging purchases amid rising costs.
Futures Market Mechanics
Margin Requirements
CME raised initial margins to $25,000 per 5,000-oz contract in late 2025 amid volatility, reaching ~9% of notional value.
Higher margins during price surges force liquidations, creating feedback loops.
Leverage Effects
Paper contracts outnumber physical delivery, enabling rapid cascades from stop-loss triggers.
Volatility Clustering Explained
Regime Shifts
Thin liquidity leads to institutional flows dominating price discovery. Silver’s dual role as industrial metal and monetary asset attracts diverse participants, heightening swings.
Current Market Context
As of February 9, 2026, silver trades around $74-78 per ounce following partial recovery. Ongoing supply tightness and industrial growth persist as key influences.
Educational Takeaways
Precious metals markets demonstrate how supply-demand imbalances and trading structures affect price behavior.
Understanding these elements provides context for observed volatility without predicting future outcomes. Readers seeking personalized financial strategies should consult qualified professionals.
Disclaimer: This article provides educational information on market dynamics and is not financial advice. Past performance does not predict future results. Consult a qualified financial advisor before making investment decisions.


MEET THE RESEARCHER
Doug Young Financial Markets Researcher & Former Financial Director
- Over 20 years of experience in financial markets
- More than 15 years specializing in Gold IRAs
- Extensive expertise in precious metals trading
- Former Financial Director at World Freight Services Ltd for 16 years.
- Author of 500+ published financial research articles over 10 years
- Conducted 80+ Gold IRA company evaluations since 2011


